State
Record the exact light pattern, operating mode, message and event number. “Green” can mean different things on different models.
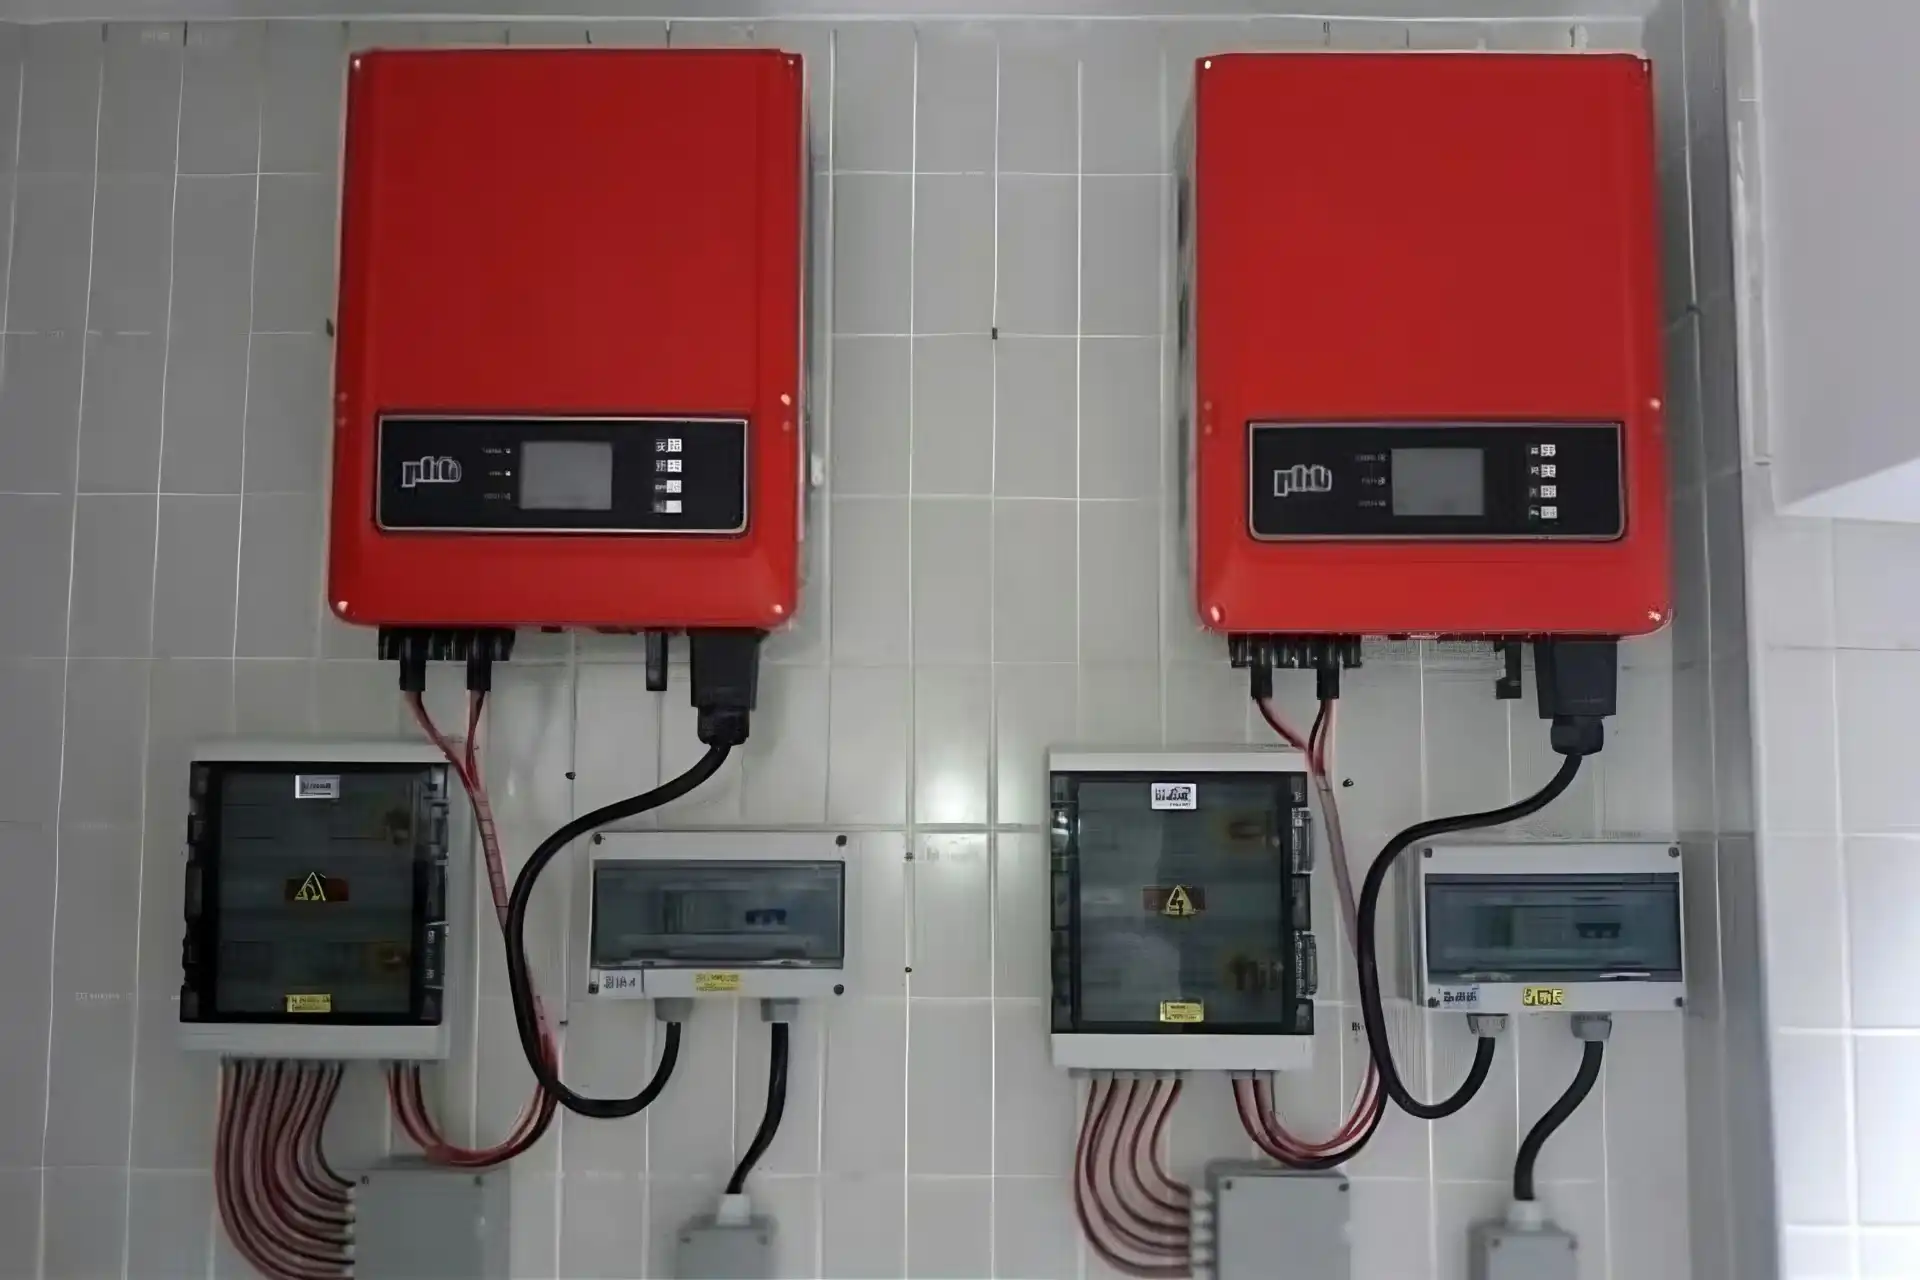
Do not judge a solar inverter by one green light. Check four separate things: its operating state, real AC power or energy, grid and communication status, and the PV DC input. Owners can make these checks from the display, portal, production meter and exterior. Opening covers or taking electrical measurements belongs to qualified personnel.
Check it during a normal daylight period. Read the exact model’s LED or display, confirm that no active fault is present, verify that the inverter reports real AC output, and then confirm that energy is increasing on a trustworthy meter or recent monitoring record.
A useful result needs more than “on” or “off.” A powered display proves that part of the unit has power. A live app proves that data is moving. Neither one alone proves that useful energy is reaching the building or grid.
Use at least two independent signs: one from the inverter or local display, and one from production data or a meter. If those signs disagree, preserve the time, error code and screenshots before requesting service.
Record the exact light pattern, operating mode, message and event number. “Green” can mean different things on different models.
Look for current AC output in watts or kilowatts. Compare it with daylight, weather, temperature and known operating limits.
Confirm that daily or interval energy in kilowatt-hours increases. A separate production meter gives a valuable second boundary.
Check whether the PV input, inverter conversion, AC protection, meter and monitoring path tell a consistent story.
Separate each observation from what it actually proves. This prevents a healthy data connection from hiding zero production, and it prevents normal nighttime standby from being misread as a fault.
The screen or control electronics have a power source.
Does not prove PV input, grid acceptance or AC production.The inverter, gateway or logger can exchange data with a network.
Does not prove the data is current or the power stage is producing.The inverter reports current AC output during suitable conditions.
Still compare the value with weather, array size and any active limit.The controller is not reporting a known present fault.
Does not prove normal energy yield or correct meter configuration.Energy is crossing the meter boundary over time.
This is stronger production evidence when the meter and CT direction are known.Read the exact manual. SolarEdge, SMA and other manufacturers assign different meanings to colors, blink rates and combinations. Even within one brand, a blue light may report communication while a green light reports feed-in or another operating mode. Record the model and serial number before interpreting the lights.
A fault, open device, configuration error or stale data can occur at a different point from the inverter itself. Map where each reading comes from before deciding which component failed.
Modules produce DC according to sunlight, temperature, shading, soiling, snow and wiring condition.
Evidence: irradiance and string behaviorConnectors, cable, fuses, combiner and DC isolator must carry the array output safely.
Evidence: approved device positions and qualified testsThe inverter tracks PV input, converts DC to AC and applies grid or system controls.
Evidence: status, DC/AC values and event logAC isolation, breakers, residual-current protection and distribution must remain available.
Evidence: qualified supply and protection reviewEnergy may serve local loads, charge storage or export. The meter boundary decides what each number means.
Evidence: interval energy and known CT directionStart when there is steady daylight and no urgent hazard. Stay outside enclosures, follow the owner manual, and stop if any step requires exposed electrical access.
Use normal daylight rather than dawn, dusk or heavy storm conditions. Note cloud cover, season, temperature, shading, snow, dirt and any known utility event. A single weak instant is not a fair performance test.
Record the inverter brand, model, serial number, string or microinverter layout, battery or backup equipment, monitoring gateway and the date of the last known normal operation.
Photograph the LED pattern or screen. Write down the full message and event code. Use the exact operating manual to interpret it; do not copy a color meaning from another model.
Read real-time AC power and today’s energy. Compare the inverter, portal and production meter. Confirm the displayed timestamp so yesterday’s value is not mistaken for a current result.
From a safe position, look for impact damage, loose enclosure parts, blocked ventilation, water entry, discoloration or pests. Listen for unusual noise and notice odor without approaching suspected hot or damaged equipment.
Only if the owner manual permits it, confirm the normal position of accessible external AC and DC isolators or approved switches. Do not operate a damaged device, defeat a lock, open a panel or repeatedly reset a tripping breaker.
Mark the system as normal, monitoring-only fault, production problem, grid/protection problem or urgent safety issue. Save photographs, screenshots, time, weather, event history and meter readings. This evidence helps the installer diagnose faster and avoids erasing useful fault information with an unnecessary reset.
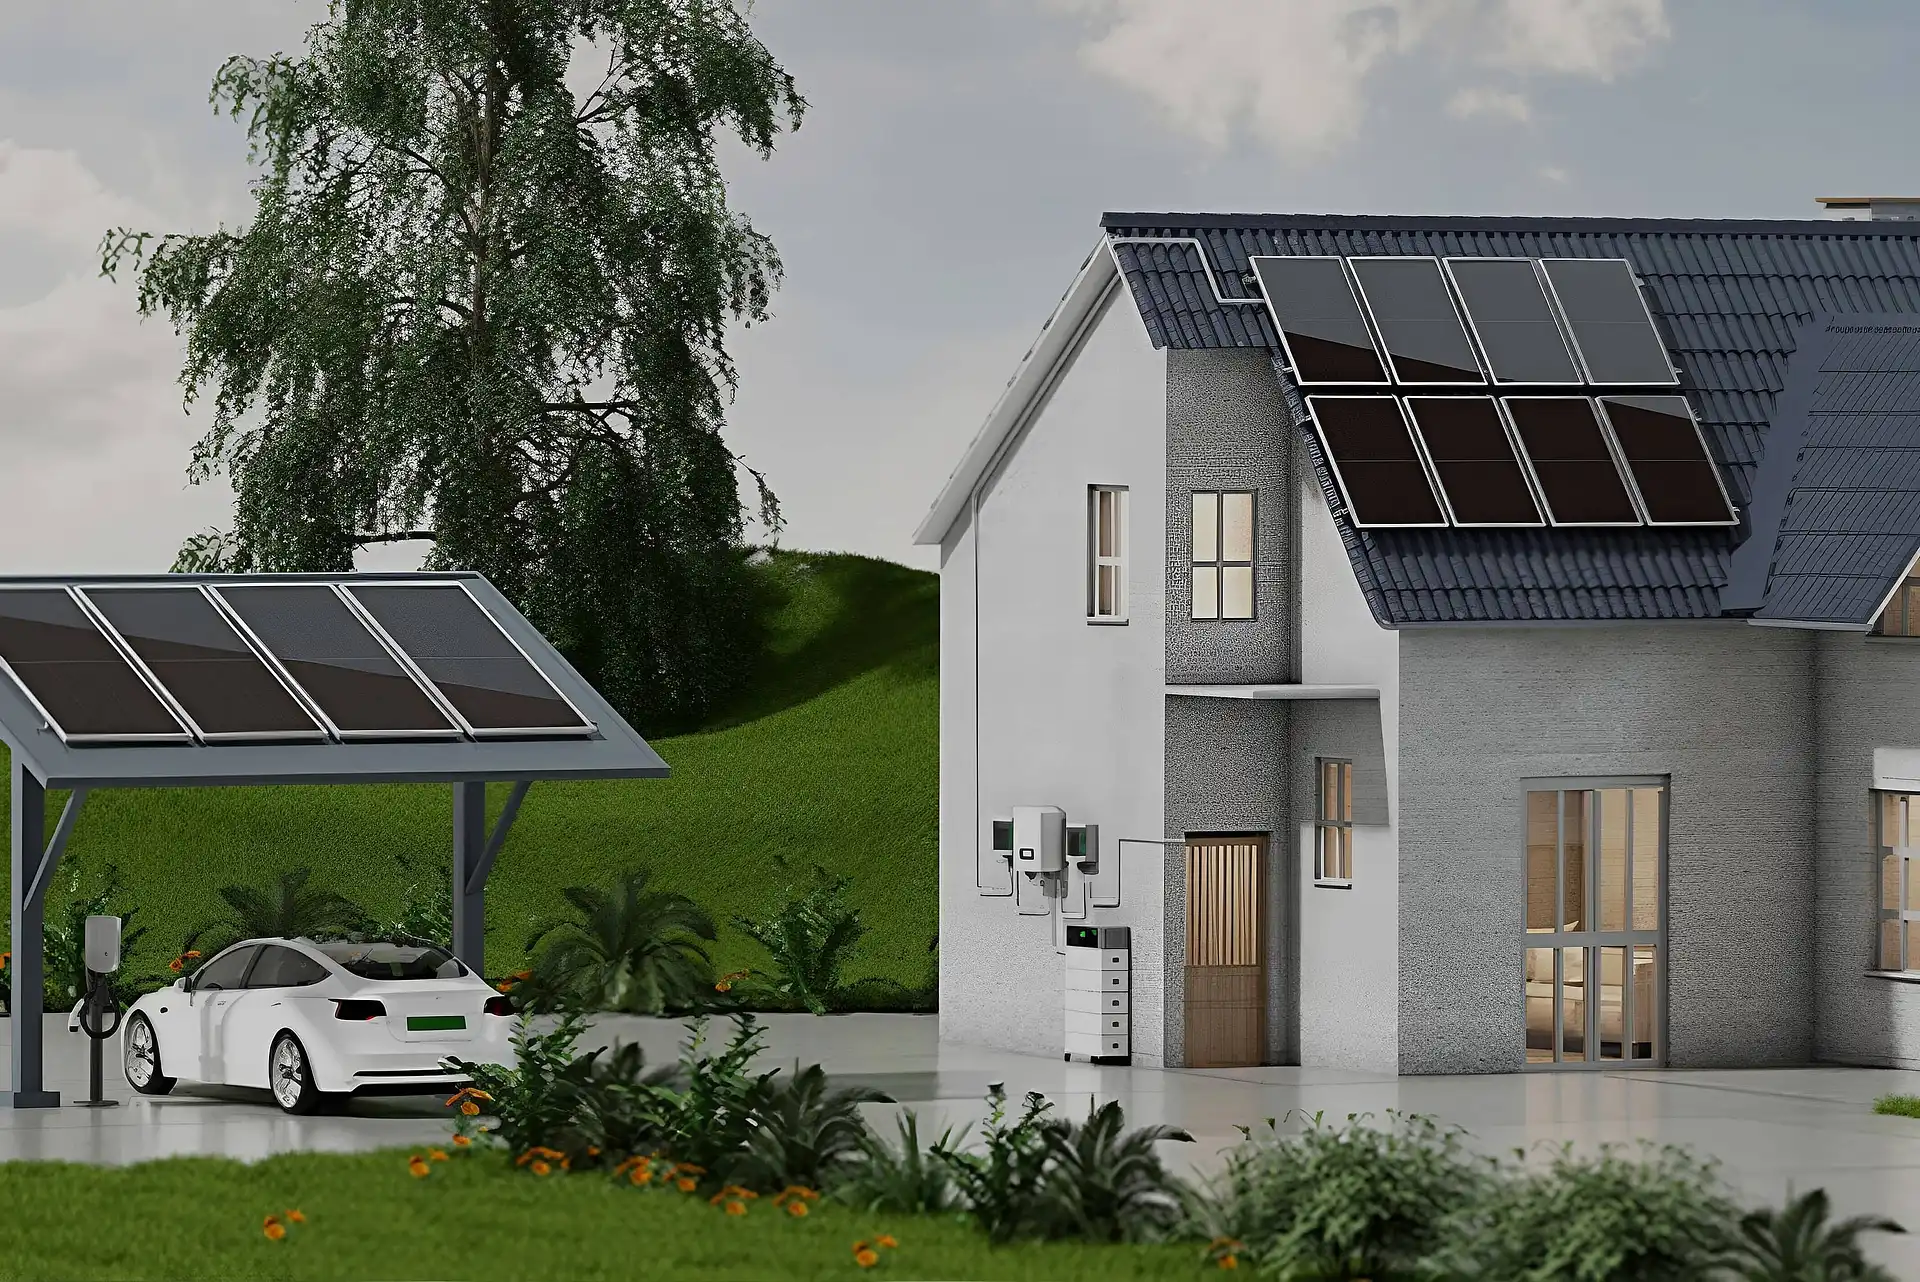
Kilowatts (kW) show the rate of production now. Kilowatt-hours (kWh) show energy accumulated over an interval. A brief kW reading helps confirm operation, but a daily, weekly or monthly kWh trend is better for finding persistent underperformance.
Do not compare the current AC value directly with the module nameplate as if full rating were guaranteed. Nameplate power is measured under defined test conditions. Real output changes with sunlight, module temperature, orientation, inverter efficiency, clipping, grid support, battery control and export limits.
Confirms that the inverter reports active conversion at this moment. Record the weather and any power limit.
Compare the meter or portal over 15 minutes, one hour or a full day under useful solar conditions.
Compare similar months or weather-adjusted periods, not one cloudy day against one clear day.
A known production meter or correctly configured digital panel meter helps separate inverter data from site energy flow.
Look for a repeatable drop under comparable conditions, a flat energy trend during good daylight, one MPPT or inverter lagging its peers, or an unexplained difference between the inverter and a trusted meter. Weather-corrected performance is more useful than a fixed “should always make” number.
A portal depends on the inverter or gateway, local network, time settings, account, cloud service and data pipeline. Any of those can fail while the power stage continues operating. The reverse is also possible: the portal may remain reachable while production is zero.
Start with the timestamp. If the last update is old, compare the local display and physical production meter before assuming an electrical failure. If local production is normal, troubleshoot communication separately. If local power and the meter are both zero in good daylight, the problem is not only the cloud portal.
Local AC output and energy increase, but the portal is stale or offline. Preserve local readings and check the gateway, network and account path.
The device is reachable, but current output is zero or energy is flat. Read events and check grid, controls and PV conditions before escalation.

The next stage may involve hazardous DC, AC, stored energy, arc-fault, ground-fault and utility-interconnection conditions. It needs the exact manual, approved test points, suitable instruments, PPE and the site’s isolation and verification procedure.
A technician uses the one-line diagram and expected array design to compare strings or MPPT channels safely.
A technician verifies the approved supply boundary and settings rather than applying a generic voltage window from the internet.
No universal reset sequence: Follow the model’s owner or service manual. Repeatedly cycling a tripping inverter or breaker can erase evidence and does not correct a ground fault, damaged cable, water entry, grid problem or failed component. U.S. DOE O&M guidance specifically warns against simply turning a nuisance-tripping system off and on without an electrical inspection.
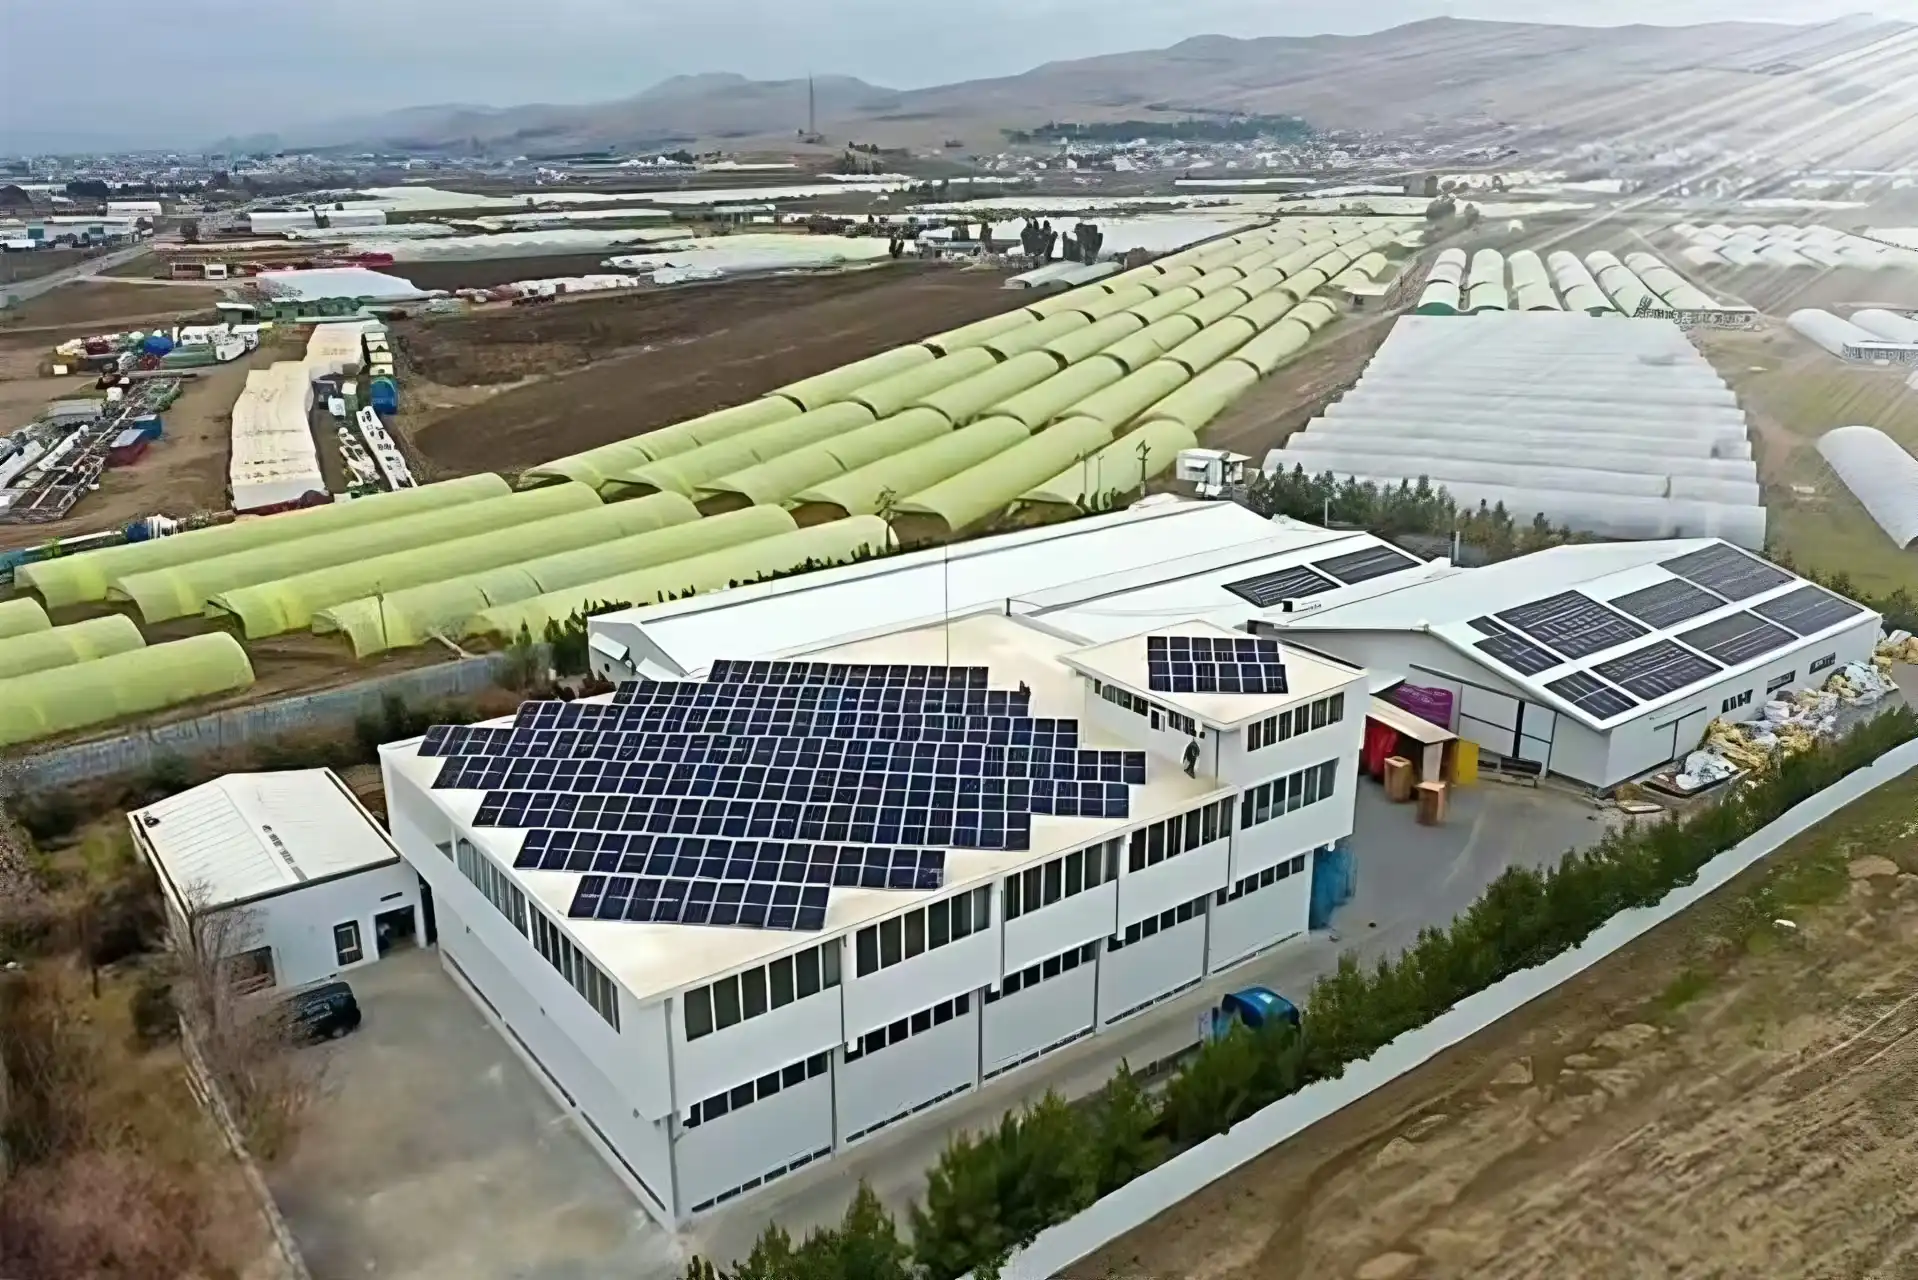
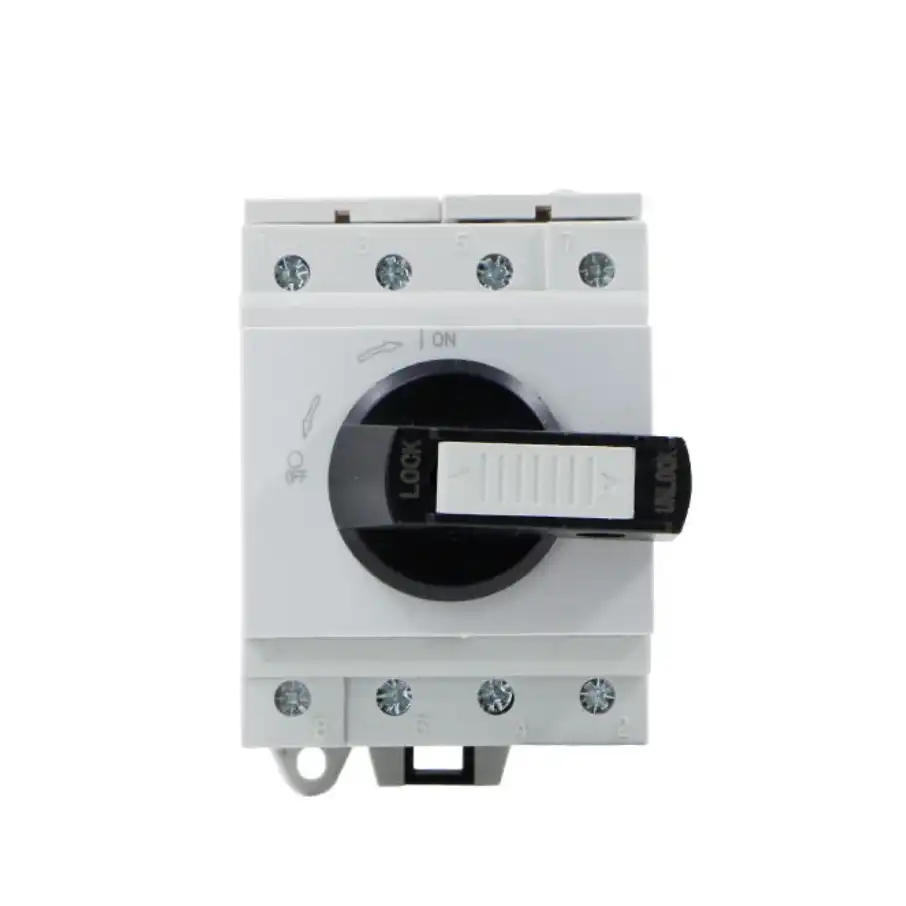
Voltage, current, polarity, utilization category, environmental rating and the complete PV path must match. An OFF handle is not permission to touch internal conductors. Review SENTOP DC isolator switch options.
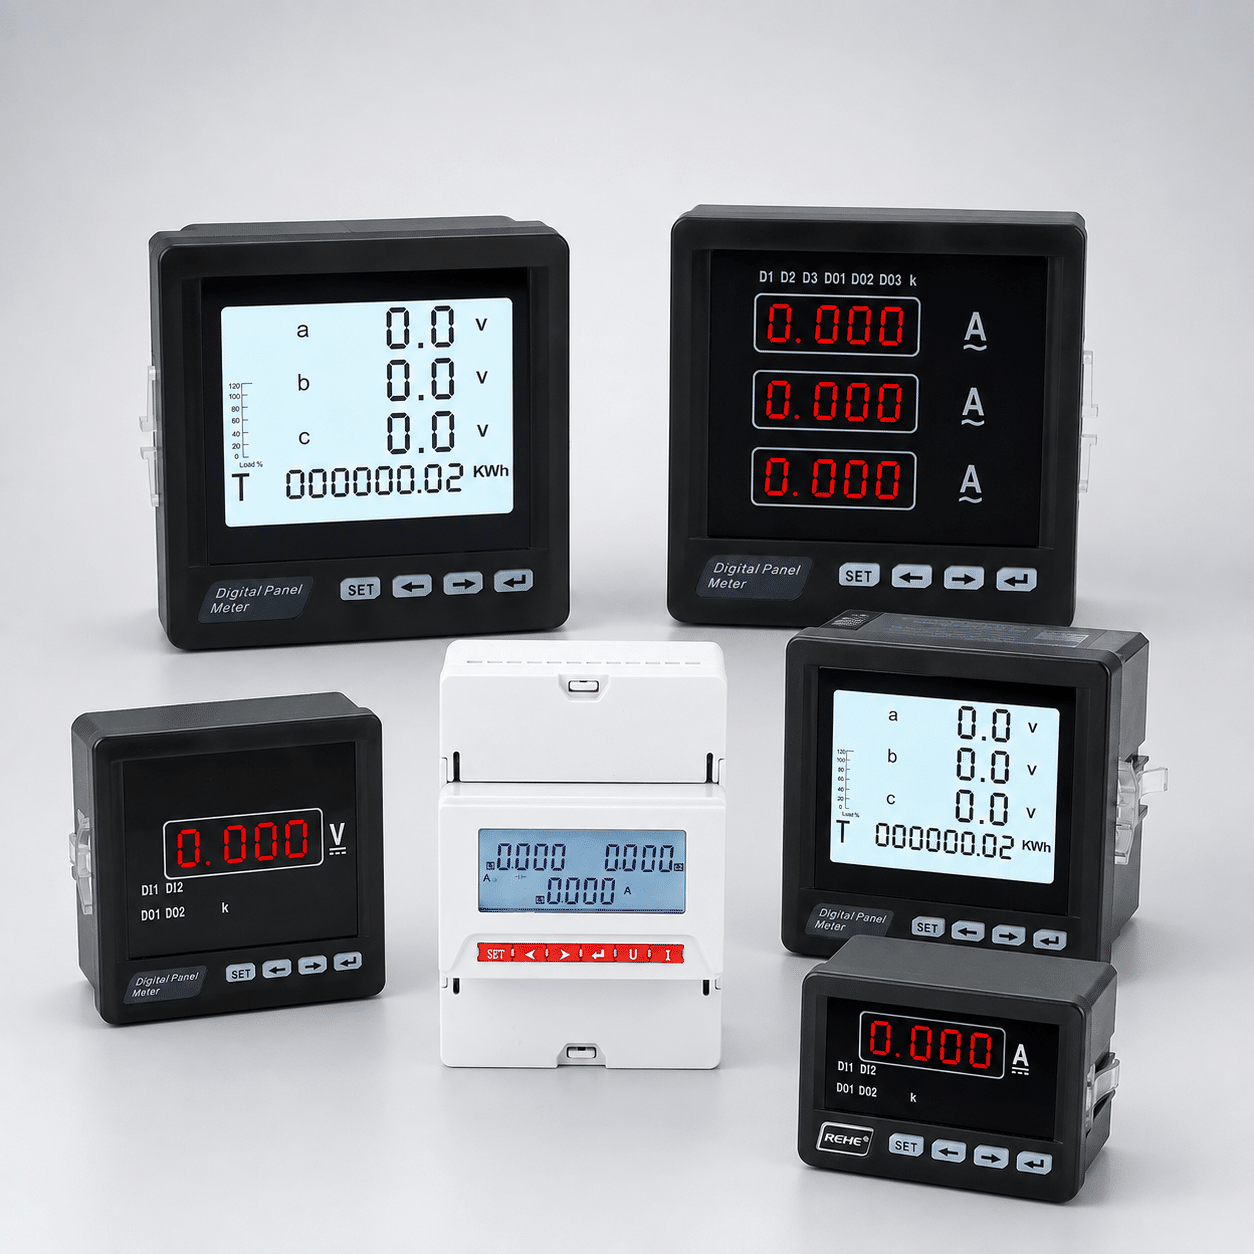
Voltage, current, power and energy only become useful when phase system, CT or shunt ratio, direction, auxiliary supply and data mapping are correct. See the panel meter selection guide.
These are starting directions, not remote diagnoses. The exact event code, model, one-line diagram and site conditions control the next safe step.
| Observed symptom | What it may mean | First owner-safe check | Service direction |
|---|---|---|---|
| Green light, but no expected production | The light may report power, standby, communication or a model-specific operating state. | Read the exact manual, current AC power, energy trend and timestamp. | Escalate if local output and the trusted meter stay flat during good daylight. |
| Portal offline, local inverter looks normal | Gateway, network, account, cloud service or time synchronization may be unavailable. | Compare local display and production meter; record the last portal update. | Troubleshoot communication separately if physical production continues. |
| Zero output in daytime | Low light, commanded limit, grid loss, open path, active event or inverter fault. | Confirm daylight, external status, error code, grid outage and accessible switch positions. | Service if the condition persists in suitable sun or an event repeats. |
| Frequent shutdown or restart | Grid event, temperature, intermittent connection, protection operation or internal fault. | Record time, weather, load, event code and frequency; do not keep resetting. | Qualified review of event history, thermal conditions, AC grid and DC path. |
| One MPPT or peer inverter is much lower | Shade, soiling, string mismatch, open string, connector, fuse or channel issue. | Compare like-for-like channels and visible array conditions. | Qualified string/MPPT measurements and targeted inspection. |
| Energy trend is lower than comparable periods | Weather, soiling, degradation, clipping, curtailment, downtime or meter change. | Compare weather-adjusted history and note any equipment or configuration change. | Performance analysis before replacing the inverter. |
| Breaker or RCD repeatedly trips | Electrical fault, leakage, protection incompatibility, wiring or inverter problem. | Stop repeated reset attempts. | Qualified electrical inspection before return to service. |
| Heat, odor, water, damage or arcing signs | Potential fire, shock or equipment-damage hazard. | Keep clear and follow the site emergency procedure. | Urgent isolation and assessment by authorized personnel. |
A microinverter system uses the same evidence logic, but the readings may be at module, branch, gateway and service-panel level rather than one wall-mounted string inverter.
Keep people away, follow the owner’s emergency and shutdown information, and contact the installer, service provider or emergency services as the situation requires. Do not touch, cool, dry, open or repeatedly energize damaged equipment.
A clear evidence pack helps a service team separate weather, data, grid, PV input, protection and inverter causes. The same information improves O&M scope and electrical component procurement for a new project.
A future fault is easier to diagnose when the project defines who owns each alarm, where measurements come from, how equipment is isolated, and which records remain available through the system life.
Include string or microinverter layout, device ratings, protective settings, labels, approved test points and emergency contacts.
State what each inverter, gateway, utility meter and production meter measures. Document CT ratio, direction, scaling and calibration responsibility.
Choose interval power and energy, inverter availability, events, MPPT or string visibility, weather inputs and alarm delivery that support real decisions.
Define which events are urgent, who reviews data, how fast a site visit occurs, how evidence is saved and who confirms return to service.
Use these answers as a safe starting point. The exact model manual, local grid rules and system design take priority.
Check it during useful daylight. Read the exact model’s status, confirm no active fault, verify current AC output, and confirm that energy is increasing on a recent portal record or trusted production meter. Use at least two independent signs rather than one LED.
Not always. A green light may mean feed-in, normal operation, standby or another model-specific state. It does not by itself prove expected energy yield, correct meter configuration or a healthy communication path. Read the exact manual and compare the light with power and energy data.
Possible reasons include very low sunlight, a grid outage, reconnection delay, export or battery control, an open AC or DC path, an active event, protection operation or an equipment fault. Record conditions and the exact event code. If zero output persists in good daylight, request qualified service.
Only follow the exact owner manual and site procedure. Do not repeatedly cycle a tripping inverter or breaker. A reset does not correct damaged wiring, ground faults, water entry, grid problems or failed components, and it may erase useful diagnostic history.
A normal grid-following inverter generally disconnects when the utility grid is unavailable. Backup operation requires a system designed for it, usually with approved storage, transfer or isolation equipment and control logic. Do not assume rooftop solar will energize normal loads during an outage.
Check the portal timestamp, then compare the local inverter display and a trusted production meter. If local power and energy continue while the portal is stale, the issue is likely in the gateway, network, account or cloud path. If both local output and energy are zero, investigate the physical energy path.
Not as a routine owner check. Illuminated PV strings can produce hazardous DC, and disconnecting connectors or using a meter at the wrong point can expose you to shock and arc hazards. These measurements should be performed by qualified personnel using the approved procedure and equipment.
Investigate a repeatable drop under comparable or weather-corrected conditions, a flat daytime energy trend, repeated events, one channel lagging its peers, or an unexplained difference between inverter data and a trusted meter. One cloudy hour alone is not enough evidence.
These sources support the safety, commissioning, operation, monitoring and model-specific status boundaries used in this guide.
For solar projects, SENTOP can review requirements for DC isolation, surge protection, circuit protection, distribution, metering and related OEM/ODM supply. Send the one-line diagram, system values, environment, target market and quantity.