
400W solar panel output guide
How to Calculate Power Generation from a 400W Solar Panel
A 400W panel does not make 400 watts all day. Estimate its daily energy by multiplying 0.4 kW by peak sun hours, then apply a clearly defined factor for temperature, wiring, conversion and other real-world effects.
Direct answer
One 400W panel often produces roughly 0.64 to 2.24 kWh per day in the 2-7 peak-sun-hour scenarios below.This range uses one illustrative 80% factor. It is a planning comparison, not a site forecast or performance promise.Planning calculator
Calculate daily, monthly and annual 400W panel output
Change the inputs to create a transparent first-pass estimate. The result is only as good as the peak sun hours and system factor you enter.
Your planning estimate
Calculated as panel kW x panel count x peak sun hours x combined factor.
This is a simplified usable-energy estimate. It does not replace hourly modeling or electrical design.
Start with the units
Watts tell you power now; kilowatt-hours tell you energy over time
The 400W label is a maximum DC power rating under specified test conditions. It is not a daily energy result.
The production rate at one moment. A monitoring screen might show 280W now and a different value one minute later.
Power accumulated over time. A meter might report 1.4kWh generated so far today.
A 400W panel operating at exactly 400W for one equivalent hour generates 400Wh, or 0.4kWh. It therefore takes 2.5 equivalent full-power hours to reach 1kWh before downstream losses: 0.4kW x 2.5h = 1.0kWh.
The U.S. Department of Energy states that PV module ratings use standard test conditions of 1,000W/m2 irradiance and 25 C cell temperature. Outdoor irradiance is often lower, while the cells are often hotter, so real-time power is commonly below nameplate. Review the DOE performance guidance.
Scenario table
How much energy can a 400W solar panel generate?
The ideal column uses 0.4kW x peak sun hours. The remaining columns use one illustrative 80% combined factor. Monthly values use 30 days; annual values assume the listed peak sun hours are a valid annual daily average.
| Peak sun hours | Ideal DC/day | Illustrative usable/day at 80% | 30-day month | 365-day year |
|---|---|---|---|---|
| 2 | 0.80kWh | 0.64kWh | 19.2kWh | 233.6kWh |
| 3 | 1.20kWh | 0.96kWh | 28.8kWh | 350.4kWh |
| 4 | 1.60kWh | 1.28kWh | 38.4kWh | 467.2kWh |
| 5 | 2.00kWh | 1.60kWh | 48.0kWh | 584.0kWh |
| 6 | 2.40kWh | 1.92kWh | 57.6kWh | 700.8kWh |
| 7 | 2.80kWh | 2.24kWh | 67.2kWh | 817.6kWh |
Planning comparison only. Replace the shortcut with location-specific monthly or hourly modeling for proposals, off-grid sizing or production commitments.
Solar resource
Peak sun hours are not daylight hours
Peak sun hours compress a changing solar day into equivalent hours at 1,000W/m2. Five peak sun hours can be spread across a much longer day.
For example, if a defined tilted surface receives 5kWh/m2 over a day, that is approximately 5 peak sun hours. Morning, evening, clouds and a low sun angle all reduce intensity even when the sun is above the horizon.
Use plane-of-array data when possible. Global horizontal irradiance describes a horizontal surface; it does not automatically equal the energy received by a tilted panel. Seasonal results also matter: an annual average may be useful for annual grid energy, while an off-grid system usually needs a low-sun design month and a stated reliability target.
From nameplate to field output
Why a 400W panel usually produces less than 400W
Irradiance, cell temperature, orientation, shade, soiling, electrical limits and availability all change the energy harvested. Each input should be modeled at the correct boundary.
| Factor | Why output changes | What improves the estimate |
|---|---|---|
| Location and season | Sun path, clouds, day length and climate change monthly irradiation. | Use long-term location-specific monthly or hourly weather data. |
| Tilt and azimuth | They change how direct and diffuse light reaches the panel. | Model the actual mounting orientation and the load season. |
| Shade | Cell strings and bypass diodes can make the electrical effect larger than the shaded area suggests. | Perform a time-based horizon and near-object shade assessment. |
| Cell temperature | Most modules lose maximum power as cell temperature rises. | Use the exact datasheet coefficient and a mounting-specific thermal model. |
| Soiling and snow | Dust, leaves, bird deposits and snow block irradiance. | Use site-specific seasonal assumptions and a safe maintenance plan. |
| Wiring and electronics | Resistance, MPPT limits, conversion efficiency, clipping and thermal derating affect delivered energy. | Use exact conductor, controller and inverter data at realistic operating points. |
| Availability | Faults, grid limits, curtailment and downtime reduce export. | Record operating rules and expected downtime separately. |
Temperature and irradiance example
The simplified PVWatts DC relationship uses effective irradiance and cell temperature. For a model-specific coefficient of -0.35%/C, a 400W panel at 800W/m2 effective irradiance and 45 C cell temperature gives:
400 x 0.8 x [1 - 0.0035 x (45 - 25)] = 297.6W DC
This is before wiring, controller, inverter and other downstream effects. Use the exact module coefficient. See the Sandia PVPMC PVWatts model.
Measurement boundary
Panel DC, inverter AC and battery-delivered energy are different answers
A solar estimate is incomplete until it states where the energy is measured.
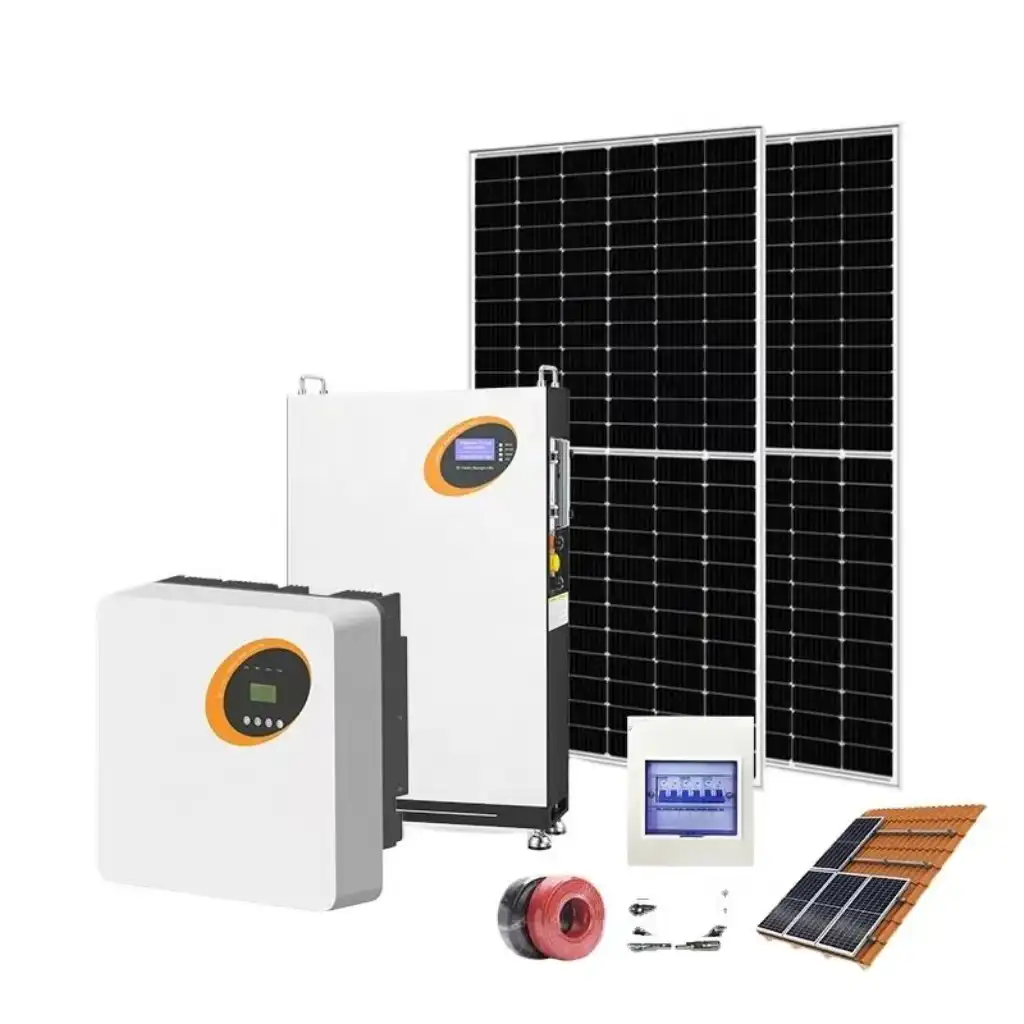
A grid-tied module sends DC energy to an inverter. An off-grid system may send DC through an MPPT charge controller, store energy in a battery and convert it later through an inverter. Losses and control limits occur between those points.
If someone quotes 1.6kWh/day, ask whether it means energy at the module, controller output, energy accepted by the battery, inverter AC output or energy delivered to the load.
Location-specific estimate
Use PVWatts Version 8 for a better grid-connected estimate
NREL's PVWatts estimates grid-connected PV energy from a small set of inputs. For one 400W module, the DC system capacity is 0.4kW.
PVWatts Version 8 uses updated weather data and improved module, thermal and inverter models. It remains a preliminary model with assumptions and uncertainty, not a production guarantee or a substitute for site-specific engineering.
- Enter the locationUse the installation address or coordinates and confirm the selected weather data.
- Set capacity to 0.4kW per panelMultiply 0.4kW by the number of 400W modules.
- Choose the real mounting typeSelect fixed roof, open rack or tracking only when it matches the system.
- Enter tilt, azimuth and lossesDo not leave defaults when the actual site is materially different.
- Set inverter assumptions onceUse the proposed DC/AC ratio and inverter efficiency; avoid adding a second generic factor later.
- Review monthly or hourly resultsRecord the model version, inputs, boundary, uncertainty and exclusions.
Equipment compatibility
The 400W label alone cannot size the controller, inverter or cable
Two 400W modules can use different voltage, current, temperature coefficients, connectors, dimensions and operating limits. Approve the exact model.
| Datasheet field | Meaning | Why the buyer needs it |
|---|---|---|
| Pmax / Wp | Maximum DC power at the stated test conditions. | Array capacity and energy-model reference. |
| Vmp and Imp | Voltage and current at maximum power. | MPPT compatibility, cable current and parallel design. |
| Voc and Isc | Open-circuit voltage and short-circuit current. | Cold-voltage, controller, string and protection checks. |
| Power tolerance | Allowed production variation around nameplate at test. | Procurement acceptance and model inputs. |
| Pmax temperature coefficient | Power change per degree from the reference cell temperature. | Hot- and cold-condition power estimates. |
| NOCT / NMOT data | A defined operating-condition reference. | A second model-specific reference, not a universal field prediction. |
| Maximum system voltage and series fuse | Declared electrical limits. | String, controller and overcurrent-protection design. |
| Dimensions, load ratings and certificates | Mechanical envelope and declared qualifications. | Mounting, shipping and destination-market approval. |
Load planning
What can a 400W solar panel run?
Divide usable daily energy in watt-hours by the load's average watts to estimate energy-equivalent runtime. Then check instantaneous power, surge and the full conversion path separately.
At 4 peak sun hours and an illustrative 80% factor, one panel provides 1.28kWh, or 1,280Wh. The table below treats that energy as available to a steady load.
| Steady load | Energy-equivalent runtime from 1.28kWh | Practical interpretation |
|---|---|---|
| 10W | 128 hours | Small lighting or electronics; storage and standby losses still matter. |
| 50W | 25.6 hours | Check the real device input and conversion path. |
| 100W | 12.8 hours | A clear energy example for a steady load. |
| 300W | 4.27 hours | Requires adequate instantaneous solar, inverter or battery support. |
| 500W | 2.56 hours | The panel cannot directly supply a 500W load when its instantaneous output is lower without another source. |
| 1,000W | 1.28 hours | Requires a suitably sized inverter and battery or grid; runtime is energy-only. |
Storage planning
Size the battery from the load and autonomy, not from 400W alone
The panel must harvest enough energy. The battery must store enough for night use, cloudy reserve and the allowed state-of-charge window.
First-pass battery formula
Nominal battery Wh = required load Wh / (allowed depth of discharge x discharge-path efficiency)
Example: 1,000Wh overnight AC load / (0.80 x 0.90) = about 1,389Wh nominal battery energy.
Use the battery manufacturer's usable-energy, current, BMS, temperature and cycle-life limits for the real design.
Check the energy balance
- Daily and hourly load energy, including standby consumption.
- Night energy and required days of autonomy.
- Permitted depth of discharge and end-of-life capacity.
- Charge, storage, discharge and inverter efficiency.
- Battery and BMS charge/discharge current limits.
- Hot- and cold-temperature restrictions.
- Worst-month solar harvest and reserve recovery time.
If the system can deliver only 1.28kWh on the design day, it cannot sustainably support a 1.5kWh daily load while also recovering used reserve.
Use-case differences
The same 400W panel needs a different calculation in each system
| Application | Primary output boundary | Critical additional inputs | Common planning error |
|---|---|---|---|
| Grid-tied microinverter | Metered AC energy | Location, roof tilt/azimuth, shade, inverter clipping and efficiency. | Using panel DC nameplate as AC output. |
| Portable power station | Energy accepted and delivered | Solar input voltage/current window, connector, MPPT limit and battery state. | Assuming every 400W panel is input-compatible. |
| RV or marine | Battery charge and load energy | Moving shade, flat mounting, heat, alternator/shore charging, vibration and corrosion. | Using an optimal fixed-roof estimate. |
| Remote monitoring or telecom | Reliable daily service plus autonomy | Worst-month sun, continuous load, duty cycle, battery temperature and maintenance access. | Sizing from annual-average energy. |
| Small off-grid cabin | AC/DC load and storage recovery | Hourly load, surge, autonomy, occupancy, generator backup, snow and shade. | Choosing panel watts before measuring daily Wh. |
Performance diagnosis
Why is a 400W panel only producing 250W?
A single low reading is not enough. Record irradiance, cell or module temperature, orientation, shade and the measurement boundary before deciding that the panel is underperforming.
| Observation | Possible explanation | How to confirm |
|---|---|---|
| Never reaches 400W | Normal irradiance/temperature behavior or a system limit. | Compare with a condition-matched model and controller/inverter limits. |
| Sudden step down | New shade, bypass-diode action, loose connection, MPPT change or curtailment. | Trend synchronized DC voltage/current, shade timing and alarms. |
| Good DC, low AC | Inverter conversion, clipping, thermal derating, grid voltage or curtailment. | Compare synchronized DC and AC data with event logs. |
| Output falls over weeks | Soiling, seasonal sun path, new shade, degradation or a fault. | Normalize for weather and temperature, then inspect and test. |
| Battery charge power is low | Battery full, too hot/cold, BMS/controller limit or wrong input window. | Check battery state, temperature, alarms and voltage/current limits. |
Purchase and design control
What to confirm before buying a 400W panel system
A useful request for quotation connects the energy target, site, exact module and complete electrical architecture.
- Define annual grid energy, daily load, backup duration or seasonal service level.
- Provide coordinates, mounting type, tilt, azimuth, shade, snow, soiling and ventilation.
- Obtain the exact module datasheet, certificates, warranty, dimensions and connector details.
- Model monthly or hourly energy and document every loss and measurement boundary.
- Match inverter or controller voltage, current, MPPT window, startup, efficiency and thermal limits.
- Check cables, connectors, overcurrent protection, isolation, grounding and enclosure requirements.
- Confirm structural loads, roof condition, waterproofing, fire access and maintenance access.
Useful SENTOP resources
- Review the SENTOP product catalogue
- Explore DC isolator switch options
- Review surge protective devices
- See how terminal blocks support solar systems
- Understand OEM/ODM and project support
Links above use the current SENTOP published-page registry reviewed for this upgrade.
From estimate to BOM
Send the site and load data for a more useful solar system proposal
Start with what you have: a module model, photo, drawing, location or project BOM. SENTOP can help organize the information needed for component matching and a qualified quotation.
- Installation location
- Tilt and orientation
- Shading and environment
- Exact module datasheet
- Daily and hourly load
- Grid or battery architecture
- Required autonomy
- Quantity and destination
Frequently asked questions
400W solar panel output questions
How much electricity does a 400W solar panel produce per day?
Multiply 0.4kW by peak sun hours and a documented system factor. At 4 peak sun hours, ideal DC energy is 1.6kWh/day. With an illustrative 80% factor, the simplified usable-energy result is about 1.28kWh/day. Actual output depends on location, season, mounting, shade, cell temperature, equipment, losses and availability.
How many kWh can a 400W solar panel produce per month?
At 5 peak sun hours per day, the ideal result is 2.0kWh/day or 60kWh in a 30-day month. Applying one illustrative 80% factor gives about 48kWh. Use monthly location-specific data rather than multiplying one unusually sunny day across the month.
How much can one 400W panel generate per year?
If the site averages 5 peak sun hours per day over the year and the chosen all-in factor is 80%, the shortcut gives 0.4 x 5 x 0.8 x 365 = 584kWh/year. A location-specific PVWatts estimate is stronger because it models monthly or hourly weather, orientation, temperature and inverter inputs.
Does a 400W solar panel produce 400 watts every hour?
No. The 400W number is an instantaneous rating at standard test conditions. Outdoor irradiance and cell temperature change continuously, so power may be much lower and can occasionally approach or exceed nameplate under favorable conditions.
Can a 400W solar panel produce 2kWh per day?
It produces 2kWh of ideal DC energy with 5 equivalent peak sun hours: 0.4kW x 5h = 2kWh. Energy delivered after temperature and system effects is usually lower. More solar resource can produce more on some days, while cloud, shade and heat reduce it.
Can a 400W solar panel run a refrigerator?
Possibly, but compare daily Wh, not only panel watts. Check compressor running power and startup surge, ambient temperature, duty cycle, battery capacity, inverter continuous and surge power, controller limits and low-sun autonomy.
What battery size is suitable for a 400W panel?
Size the battery from required load energy and autonomy. A first pass is nominal battery Wh = required load Wh / (allowed depth of discharge x discharge-path efficiency). Then verify current, BMS, temperature, charge acceptance and whether the panel can refill the used energy in the design season.
Should I use 20% losses for every 400W solar calculation?
No. An 80% factor is only a clearly labeled first-pass scenario. Real losses vary with mounting, climate, shade, dirt, wiring, electronics, batteries, downtime and the measurement boundary. Do not apply the factor again to an AC result that already includes those effects.
Technical references
Sources and calculation limits
- NREL PVWatts Calculator - preliminary grid-connected PV energy estimates.
- PVWatts Version 8 API documentation - official input, output and model-version definitions.
- PVWatts Version 8 information and cautions - updates, weather data and uncertainty.
- Sandia PVPMC PVWatts DC model - irradiance and cell-temperature equation.
- U.S. DOE photovoltaic performance guidance - standard test conditions and field-performance factors.
- U.S. DOE photovoltaic system design and energy yield - heat, dirt, shade and harvested energy.
- NREL PVWatts Version 5 Manual - legacy technical reference for system-loss categories and multiplicative combination.
- JinkoSolar JKM400-420M-54HL4 datasheet - model-specific 400W example.
- NREL System Advisor Model photovoltaic publications - detailed PV and PVWatts model resources.